Sun Devils share ‘Recipes for Data Success’ at 5th Annual ASU Data Conference
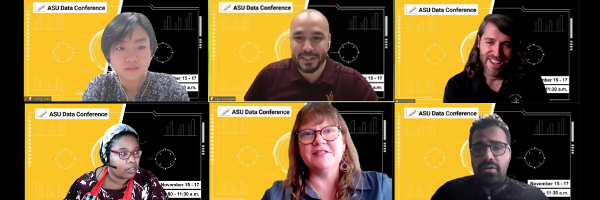
Swapping data recipes, sharing the tools that help create ASU’s secret sauce and having fun — that’s what more than 800 ASU data enthusiasts registered to do at the 2021 ASU Data Conference on November 15-17.
Attendees gathered virtually for three days in the ASU data kitchen to sample new data tips, tricks and tools with master chefs while celebrating the theme for the fifth annual event, “Recipes for Data Success.” The ASU IT community wrapped up their time together at Sliced!, the university’s first-ever live, in-person data competition to see who would take home the coveted title of Sliced! champion.
What better way to explain all that happened at the conference than by the numbers? Read on to get the scoop on what was cooking at the 2021 ASU Data Conference!
2021 ASU Data Conference: By the numbers
5 steps to a successful culinary (data) experience
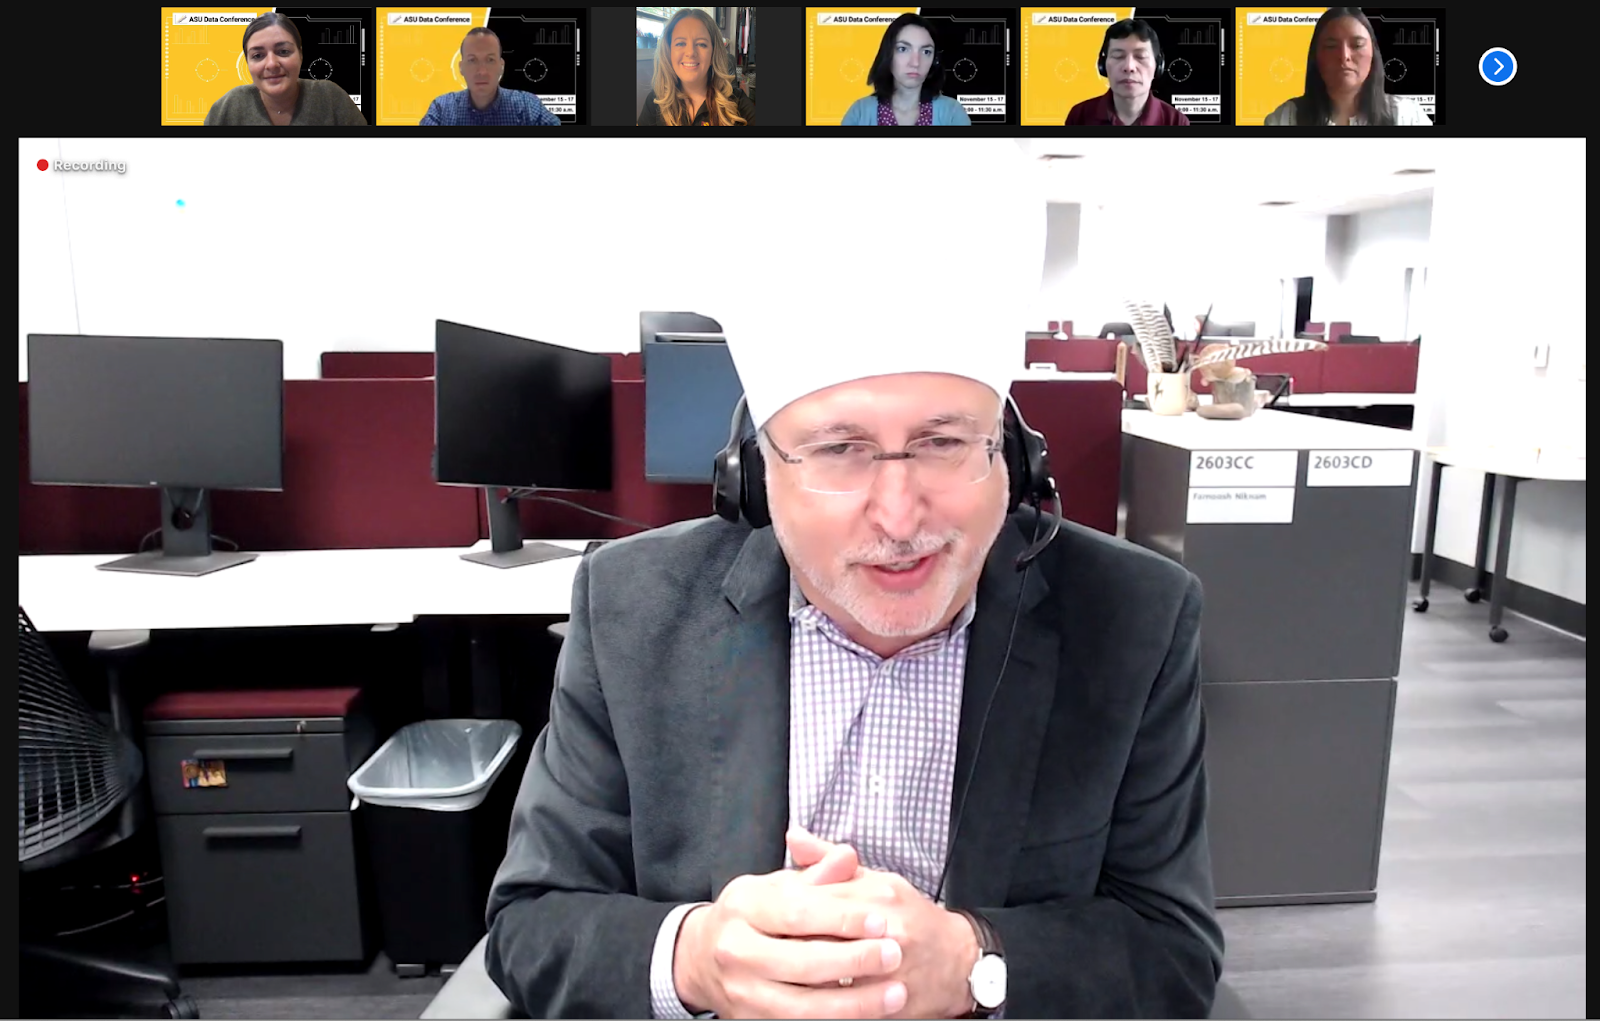
During the Data Conference’s Welcome session on Monday, November 15, ASU CIO and culinary masterchef Lev Gonick shared his quick recipe for an excellent data experience, using kitchen puns to lean into this year’s theme. The five steps included:
- 1. It’s all about the ingredients. “Good quality ingredients are the key to any recipe and success in the kitchen,” said Gonick. “It’s all about the quality of the data and creating governance for this collection. That’s much easier said than done.”
- 2. You have to have a great collection of tools to work with. “That’s what we’ve been doing at ASU,” said Gonick. “Making sure we have the best tools for the broad range of needs that we have when it comes to analytics.”
- 3. Preparation and organization is key. “Seventy percent of the time or more, it’s all about the prep or proverbial sausage making,” said Gonick. “It’s a ton of scrubbing and wrangling and that is the absolute ‘bread and butter’.”
- 4. Execution and the delivery. “It’s about bringing the IT tools that we have to literally hit the executable,” said Gonick. “Assessing whether or not the cakes are ready to come out of the oven and ‘taste’ testing to make sure the data is prepared to exactly what the customer needs.”
- 5. When the plates go out, the presentation is what the customer sees. “For the customer, all of the other elements are essentially invisible to them,” explained Gonick. “So the report writing, presentations, and visualizations of the data are actually what most of our customers see. It’s hugely important for us to understand the needs of the customer and what the customer can actually consume.”
6 steps to center data equity that were shared by Conference plenary speaker Heather Krause, founder of We All Count Project. 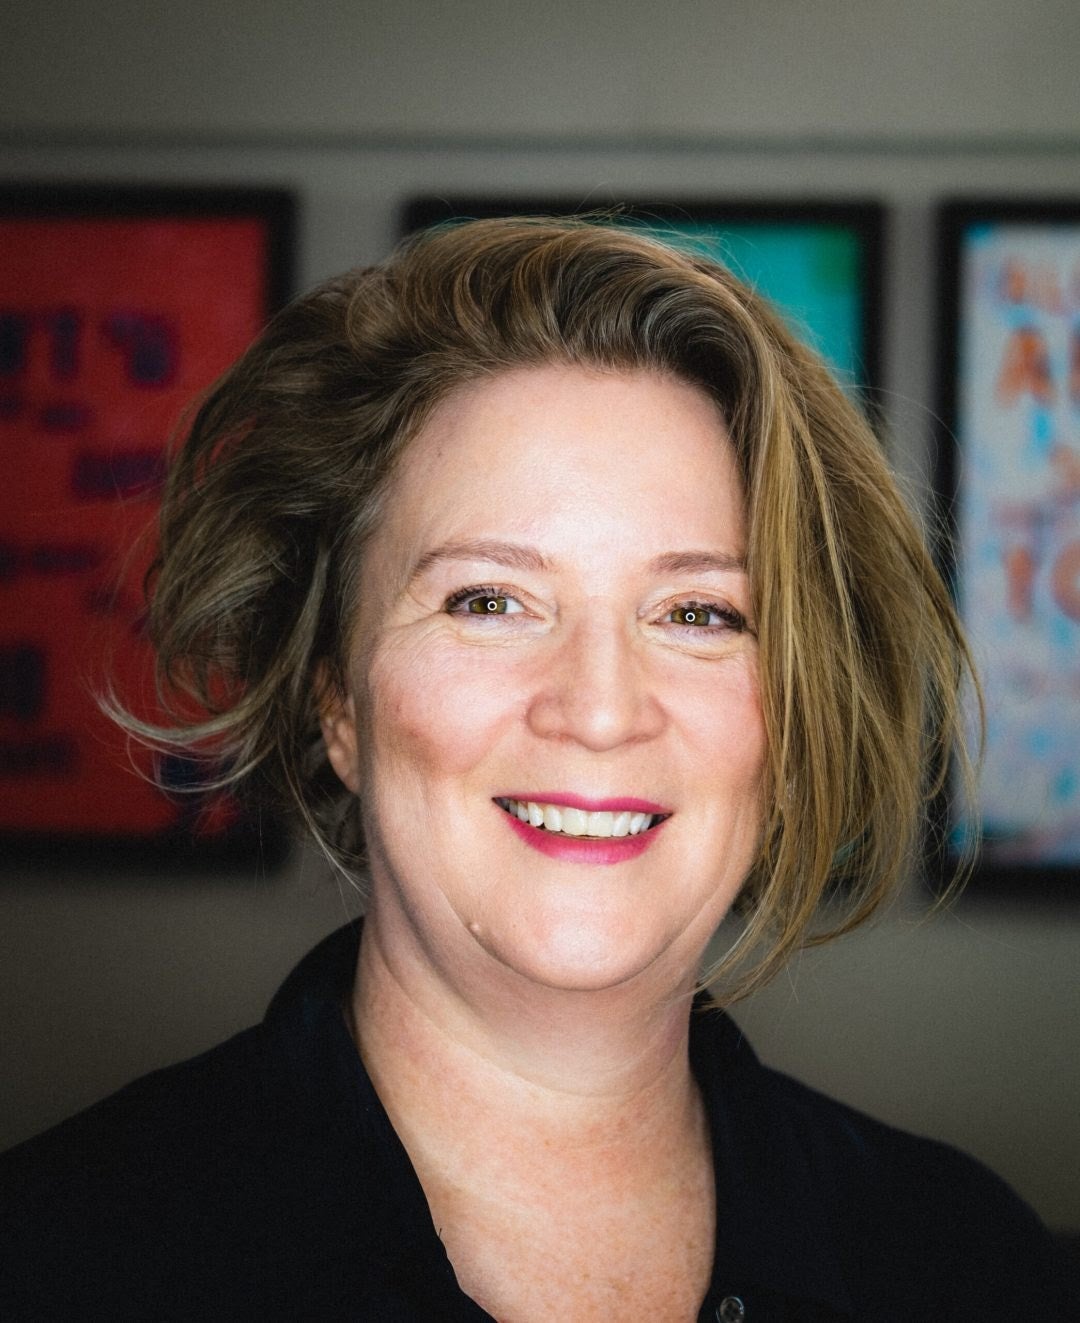
Following Gonick’s 5-step recipe for success, Krause gave an inspiring plenary about centering data equity in one’s work. Her steps to data equity include:
- 1. Recognize we’re all making subjective human choices.
- 2. Identify as many of those choices in your data processes as possible.
- 3. Make the choices in your data projects that reflect the equity that you want to see (there are no data projects that don’t involve critical thinking).
- 4. Expand the group of people who get to make meaningful choices about the data processes.
- 5. Be transparent about your data choices anytime you’re putting out a report or building a dashboard or making decisions.
- 6. Be ready to go back to the beginning and make even better choices next time.
2 Sun Devils won the coveted title of Sliced! Champions
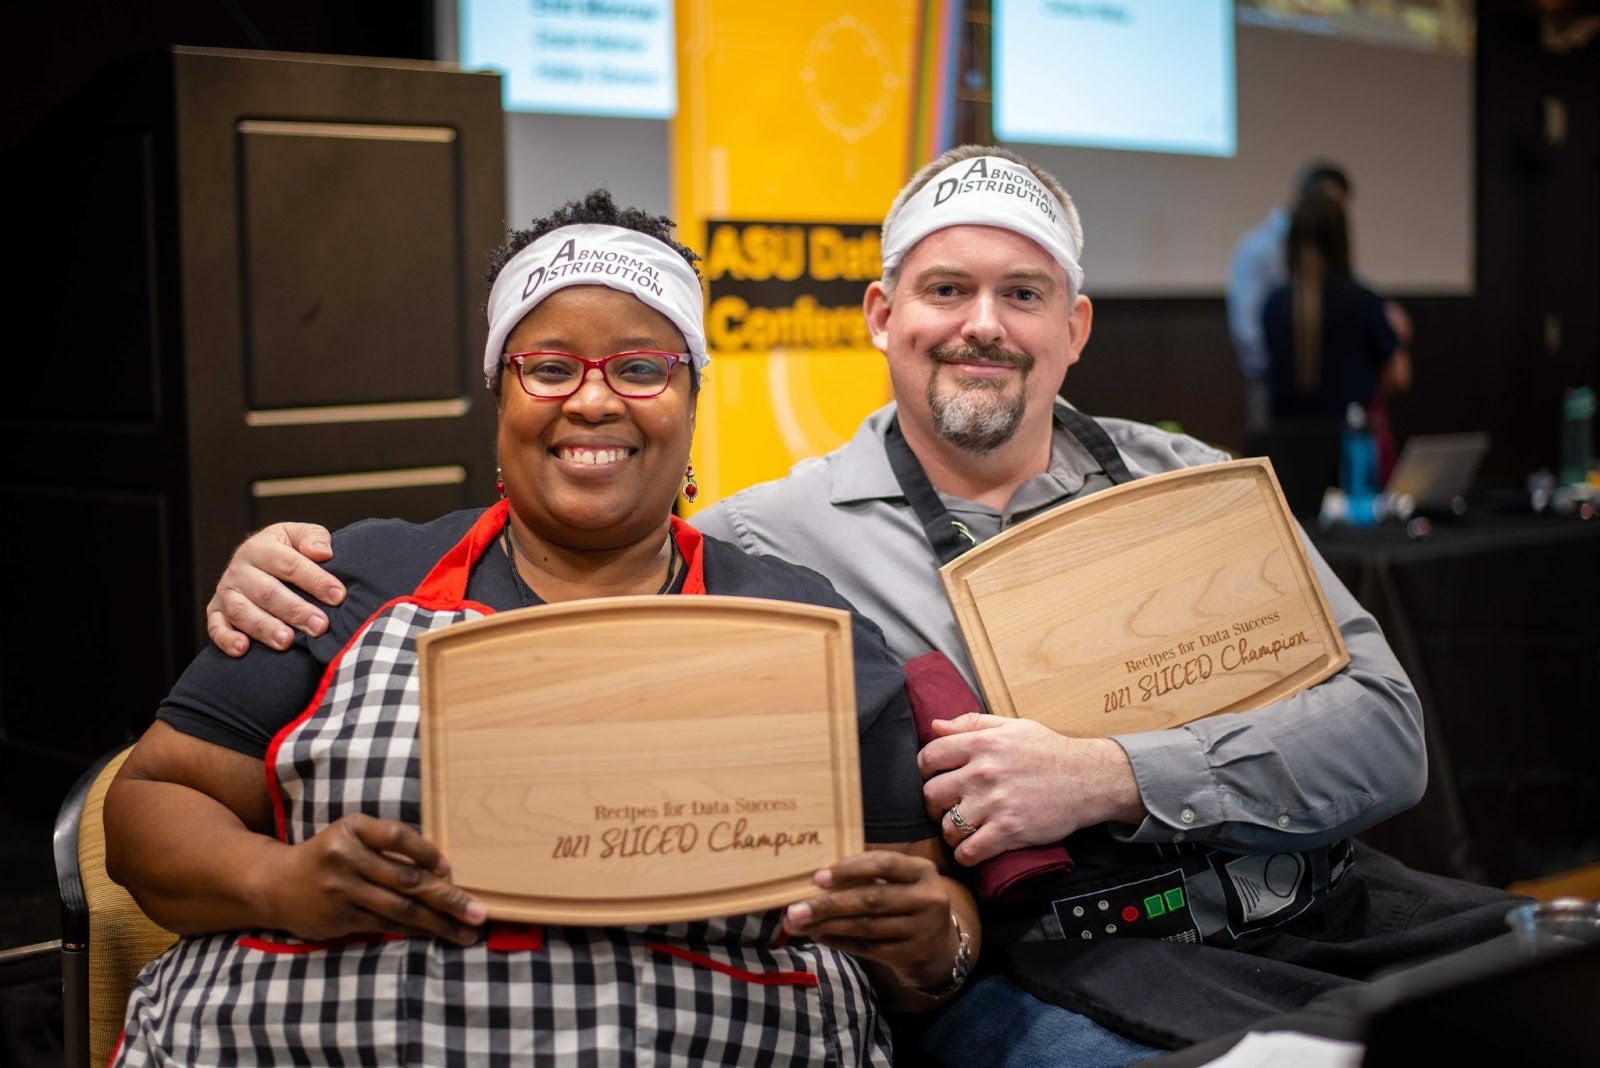
Ten contestants battled it out in front of a live audience at Memorial Union in Tempe, but only one team of two took home the trophy: Jenna Graham and Ferenc Fehrer of Team Abnormal Distribution!
Judged on areas like accuracy, design, and cohesive storytelling, Graham said it was an honor to be part of one of the teams for this inaugural portion of the Data Conference, and Fehrer agreed. “Between being the only Tableau person in my college and COVID-19 reducing opportunities and ease of collaborations, it felt great to work with my peers.”
What was their secret ingredient to success? Graham says collaboration and preparation. “We both brought something unique to the team,” said Graham. “I tend to work alone on my projects, but it was nice to have a partner whose talents complemented mine and vice versa.”
For both Graham and Fehrer, their win offered them a sense of how much they’ve grown in their skill sets. “Two years ago when I started in my current position, I had never used Tableau before,” said Fehrer. “Winning gave me a sense of how far I have come.”
“We hope that attendees learned a new tool, tip, or trick that they can use to make their data analysis life better, an appreciation for the many folks who spend lots of time figuring out complex data things at ASU, and the fact that they are a part of a smart, dedicated, and collaborative community of data professionals,” said Mike Sharkey, Director IT, Data Analysis, and host of the Sliced! event.
110: Largest number of participants at a Data Conference session
“It’s Thyme to Excel” was the conference’s most attended session with more than 110 participants! Steven Munsen, Christina Smith led this useful session, sharing tips to make using Excel more approachable.
View all 35+ ASU Data Conference sessions on the University Technology Office’s YouTube page.
5 years that ASU has hosted the Conference for its colleagues to knowledge share, network and have fun
Business Intelligence Developer Principal Kristin Kennedy, who helped to found the Data Conference five years ago, admitted that she’s struck by how different things are since 2016, like expanding the planning team and using Slack prevalently in their communication to the more than 800 conference registrants. Being virtual instead of in person is also a major shift. “While much has changed, it still was a great opportunity for our data community to come together and share with each other, not only what we do, but also our connections to others who struggle like we do,” said Kennedy. “It gives us even more of a sense of community and what a community it is!”
45 badges earned
The ASU Data Conference offered eight digital badges to share what attendees earned and learned while in the virtual conference kitchen.
For example, the Data Finding badge is given to those that know their limitations and therefore have upskilled to learn where to find reports, how to ask for new ones and where to go with questions.
19 data celebrations shared during the Conference
Every day the ASU IT community is doing amazing things, and the conference planning team wanted to celebrate it! During the Data Conference, participants were invited to share celebratory stories or kudos for someone who helped them create a recipe for Data Success.
During their Data & Culture session, Kristin Kennedy and UTO’s Chief Culture Officer Christine Whitney Sanchez shared how they created these virtual forms of recognition as part of creating a more positive culture in the University Technology Office. “We take an appreciative approach to culture transformation,” Whitney Sanchez said. “So the Certificates of Appreciation and the Celebration Channel have made it easy for us to share the love.”
Baking up delicious data delights
Why is the ASU Data Conference a sweet treat year after year? It always cooks up opportunities to share the university’s secret sauce and help the data community develop and test their own recipes for success. “We wanted attendees to come away with something they can use to enrich their own data work,” said Elizabeth Reilley, Director of Data Solutions and member of the Data Conference planning team. “That might be anything from a better understanding of a report they already use to a new analytics skill or tool added to their drawer of cooking implements.” And that’s exactly what was on the menu.
For more details on the 2021 ASU Data Conference, visit the event webpage.